|
On this page, we present illustrative examples of FT-EIS data plotted using the ACV format Experimental system: 38 nm thick Au film electrode ( vacuum-deposited on SF-10 glass using an intermediate 1.7 nm thick binder layer of Cr) in 0.05 M NaClO4 + X mM Fe(CN)63/4- or 0.05 M NaCl + X mM Fe(CN)63/4- (X = 0 or 5). Experiment: The redox reaction is activated using cyclic voltammetry
(CV) between -0.5 V and 0.5 V at 5 mV/s. FT-EIS is performed at the
same time, collecting a full Nyquist (or Bode) plot at 1 s intervals
during the CV scan. A computer generated broadband perturbation signal
(2.5 mV mplitude), containing a superposition of 190 sinusoidal waves
(100 Hz - 40 kHZ) is used. The recorded raw EIS data (after FT) contain
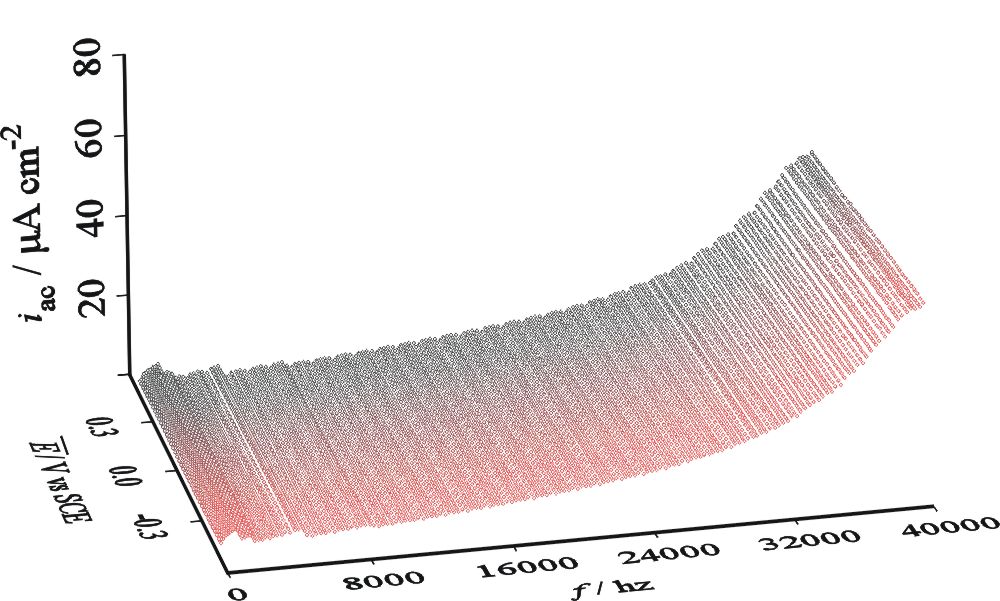
AC current amplitude (iac) as a function of (i) the D.C. voltage Experimental data: 3-D plots of A.C. currents against
Figure 1. Redox reaction in the presence of adsorption-desorption of ClO4-
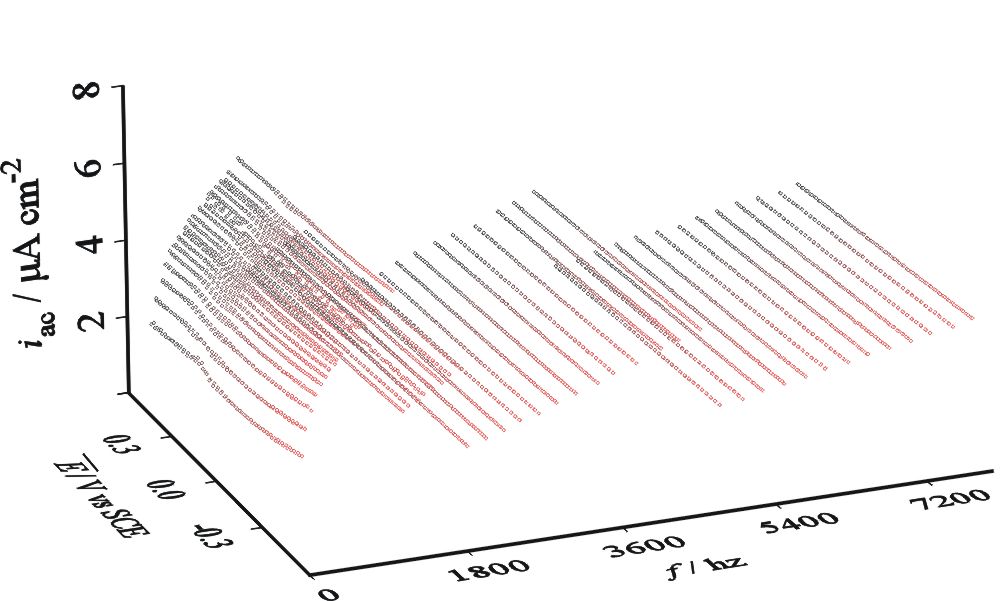
Figure 2 Redox reaction in
the presence of adsorption-desorption of ClO4- ;
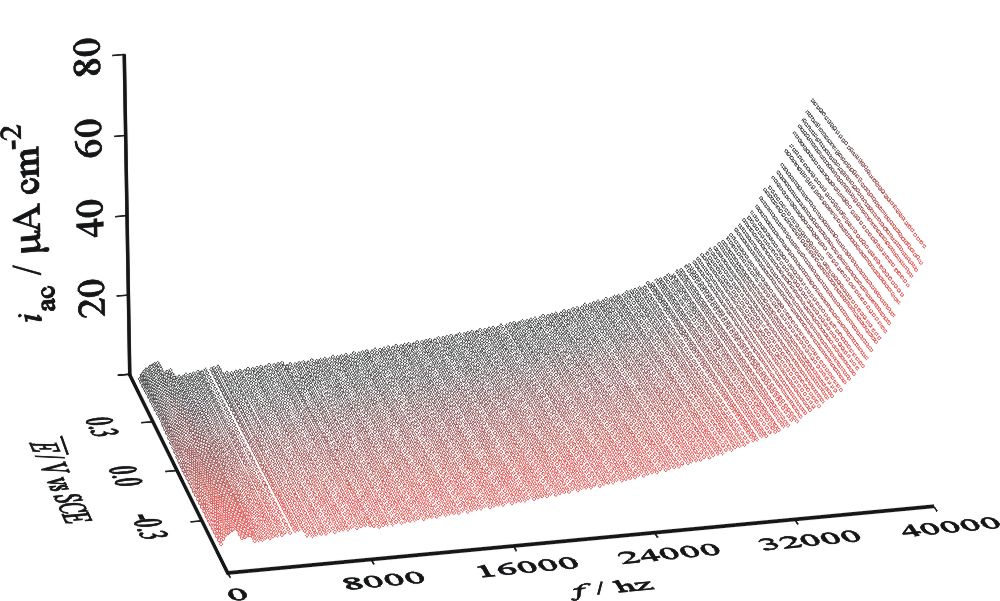
Figure 3. Redox reaction in the presence of adsorption-desorption of Cl- Contact: D.
Roy ã D. Roy Back
to Current Research Page |
||