|
Roy
Research Group Home || Research
|| Publications
|| Group
CURRENT
PROJECTS Corrosion
monitoring using FT-EIS
Time
dependence of the structural stability of a corrosion protective film A typical setup for these measurements is schematically shown in Fig. 1 below. The electrically conducting sample containing the protective coating under study is used as the working electrode in a typical three-electrode cell. The electrolyte is composed of a relatively non-reactive background solution (like KClO4 or KNO3 with anions unlikely to exhibit strong chemisorption at the electrode surface).
Figure 1. A three electrode set-up for FT-EIS testing of
corrosion protective films on metals and alloys. The working, counter and
reference electrodes are denoted as WE, CE and RE, respectively. The applied voltage has a DC and an AC component: V = Vdc + Vac, where Vdc is set at or near the open circuit potential (OCP) of the system and Vac (small amplitude, ~5 mV peak-to-peak) is used as the perturbation signal for EIS. The net current contains a DC and an AC component, I = Idc+Iac (Idc ~ 0). These current components and the phase difference f between Vac, and Iac are measured, and the total AC impedance, Z, of the working electrode is obtained in real time (t). This analysis uses the following main formulas for each angular frequency w used in the perturbation spectrum: Vac = V0 sin wt, (1) Iac = I0 sin (wt +f), (2) Z¢ = (V0/I0) cos f, (3) Z¢¢ = (V0/I0) sin f, (4) Z = [(Z¢)2 + (Z¢¢)2]1/2, (5) where V0 and I0 are the AC voltage and current amplitudes,
respectively; Z¢ and Z¢¢ are the real and imaginary components of Z, respectively. FT-EIS allows for the
measurement of (Z¢ vs. Z¢¢) Nyquist plots
of the full spectrum (typically ~190 frequencies between 100 Hz and 40 KHz) in
1 s, and this in turn allows for real time measurement of Z(t). The value of Z is a measure of the surface insulating capability of the
protective film; higher values of Z represent better corrosion protection.
The overall film impedance can be determined by comparing the working
electrode impedances in the presence and in the absence of the surface film.
If the value of Z for the film-coated sample does not decrease in time, the
data indicate a stable, defect-free film. Z
values decreasing with increasing time would indicate time dependent
degradation of the corrosion protective film.
Quantitative
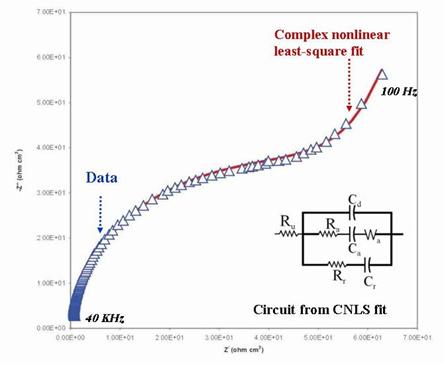
analysis of corrosion kinetics using FT-EIS EIS can be used for quantitative investigation of surface chemistries that are associated with corrosion reactions, and FT-EIS can further expand the analytical framework of this approach by adding its time-resolved capabilities. In EIS, information about surface reactions is obtained by complex nonlinear least square (CNLS) fitting of experimental impedance spectra (Nyquist or Bode plots) to electrical circuit models of the reactive interface. Both the composition of and the values of the constituent elements of such a circuit contain useful information about the mechanism and kinetics of corrosion reactions. A specific advantage of using FT-EIS for such studies is that it can provide a series of these circuits in real time during surface reactions, and as functions of various external control variables (electrolyte composition, temperature, and D.C. polarization, etc). To explain the basic concept of electrode-equivalent circuits (EECs), let us note that the current pathways for the arrangement in Fig. 1 can also be represented schematically as shown in Fig. 2.
Figure 2. Schematic equivalent circuit representation of the
3-electrode cell-connections considered in Fig 1. (A) The electrode-electrolyte interface is
indicated with the dashed line at the WE. The RE usually is connected through
a very large resistance (located inside the potentiostat) that ensures zero
current flow through the RE branch. The cell current flows between the CE and
the WE. (B) RW is the solution resistance between the CE and the RE.
Rs is the uncompensated
solution resistance (sometimes denote as Ru),
and depending on ionic concentration of the solution, can become a relevant
source of ohmic drop at the WE, making it difficult to measure the true
electrode potential. The impedance of the working electrode in Fig. 2B is denoted as Z, without specifying the composition of Z. Detailed makeup of this Z for a given system can be determined by CNLS fitting of experimental impedance spectra; an example spectrum is shown in Fig. 3.
Figure 3. Example of an EEC obtained by CNLS fitting of an
experimental impedance spectrum. The WE is a metal, immersed in a solution
containing two types of anions, (denoted by “r” and “a”). The two branches
containing Ra-Ca-Wa and Rr-Cr correspond to reactions
of these two ions with the electrode surface. Ru (same as Rs
considered in Fig. 2) and Cd
are the uncompensated solution resistance and the double layer capacitance,
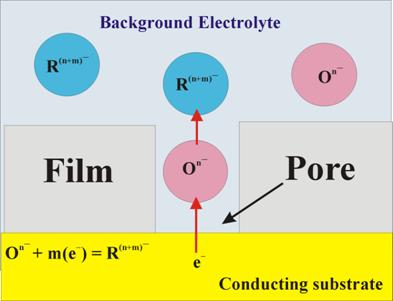
respectively. Often a standard redox reaction can be used to probe the reactivity of the (metal or alloy) sample surface in the presence or in the absence of a corrosion protective coating on the sample. A typical situation involving the latter case is schematically shown in Fig. 4, where the electrochemical experiment is designed to test the presence and the extent of defects (cracks, pores and pinholes) in a surface protecting film.
Figure 4. Schematic representation of a relatively simple experimental
strategy for electrochemical probing of pores and cracks in surface protective
films. The electrolyte contains a relatively non-reactive background solution
of non-specifically adsorbing anions, and low concentration (~0.1-0.5 mM) of
a standard anionic redox couple, [On-/R (n+m)-]. The choice
of the redox couple depends on the electrode and the background solutions
used, and must be such that both the
oxidized [On-] and the
reduced [R (n+m)-] forms of the
redox species are
chemically compatible with the background solution and the electrode. In other words, the redox species must not
disintegrate to form other chemicals through chemical or electrochemical side
reactions. A polarization voltage can be applied across the WE-solution
interface to trigger the oxidation or reduction reaction, and the resulting
electrode current can be measured as a function of the applied voltage using
standard cyclic voltammetry (CV).If the surface film is completely
insulating, reaction currents can only flow through the pours and cracks in
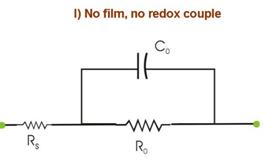
the film. In the situation considered in Fig. 4, the primary source of the electrode current is that caused by the redox reaction. In DC-CV, the magnitude of the observed current Idc is measured as a function of the applied voltage Vdc, and the magnitude of the current can be taken as a measure of the surface coverage of pores (extent of defects) in the protective film (larger currents implying more defective film). This represents a relatively standard method for studying defects in surface films on electrically conducting substrates. Apart from the DC measurements mentioned above, AC-EIS can provide further detailed information about surface reactions considered in Fig. 4. The working principle of these AC measurements is illustrated below using the EECs shown in Fig. 5. The essential elements of this approach have been previously developed by several research groups in electrochemical studies of organic self-assembled monolayers (SAMs) on solid surfaces.
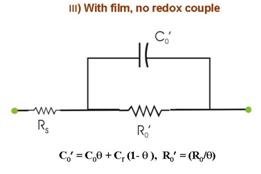
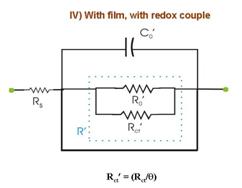
Figure 5. Electrode equivalent circuits obtained by CNLS
fitting of experimental Nyquist plots from an EIS experiment involving a typical
substrate-film-redox system as the one described in Fig. 4. q is the fractional surface coverage of cracks and
pours in the film. These EECs usually are system-specific, and here we assume
a specific case only for the purpose of
illustration. The experimental impedance spectra for such studies usually
are taken at a fixed voltage at the OCP. FT-EIS allows us to record several
such spectra within a short time over a small DC voltage range (of linear
polarization) near the OCP. The multiple spectra available (within a short
measurement time under a given set of DC conditions) in the latter approach
helps to easily confirm the makeup of the CNLS analyzed EECs. In addition,
FT-EIS is particularly useful in such measurements if the system exhibits
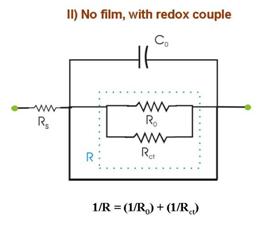
time dependent reaction characteristics. The experiment considered in Fig. 5 involves the following four separate measurements of Nyquist spectra under different conditions: (I) Using bare WE in the redox-free background solution, where only weak adsorption of anions from the solution is operative. In Fig. 5.I, R0 represents the reaction resistance of this adsorption process (capacitive reactance of this process is assumed to be small compared to R0); Rs and C0 are the solution resistance and the double layer capacitance, respectively. (II) The redox species is introduced in the system considered in (I). If the redox concentration is low, the value of C0 is not significantly affected, but the redox reaction now introduces a charge transfer resistance Rct, connected in parallel with R0. These two resistances cannot be separately resolved in EIS measurements. Only a net resistance R, resulting from the combination of R0 and Rct is detected. (III) The sample is film-coated and immersed in the redox-free electrolyte. The conducting substrate is now in contact with the electrolyte only through the regions of the pours and cracks in the film. Thus, the adsorption resistance of anions as well as the double layer capacitance is now scaled by the fractional surface coverage q of these defect sites. (IV) The redox species is added to the system considered in (III). Like R0 and C0, the value of the charge transfer resistance Rct is also scaled by the value of q. Apart from Rs, the net circuit elements detected in this case are R¢ and C¢. Within the limits of certain assumptions, the impedance parameters obtained from the four sets of measurements can combined to determine several characteristic parameters describing the structural properties of the film; these parameters are summarized in the Box below.
Combining
FT-EIS with measurements of linear polarization resistance (LPR) and Tafel plots
for accurate determination of corrosion rates Traditional DC electrochemical methods of corrosion monitoring are often based on the measurement of linear polarization resistance (LPR, Rp), coupled with Tafel analysis of potentiodynamic polarization plots. Results obtained from these two methods can be combined to obtain the corrosion current, icorr, which frequently is used as a measure of the rate of corrosion. Although these are fully established and widely used techniques, interpretation of experimental data in such measurements can become complicated if the uncompensated solution resistance is not negligible (which often is the case, depending on electrode configurations and electrolytes used for sample-testing). This problem is briefly noted below using the essential considerations for LPR measurements. The net current in the corrosion cell has the form: where his
the applied overpotential, The LPR is defined as The Tafel slopes in Eq. (8) can
be determined by standard extrapolation method using log (I) vs. V graphs (in
the Tafel region) recorded in potentiodynamic polarization experiments. In
addition, The analysis of Eqs. (6)-(7) is strictly based on the assumption that the uncompensated solution resistance Ru is negligible. For systems where this assumption is no longer valid, the actual electrode overpotential changes from h to a new value h¢, where the applied DC potential Vapp is no longer equal to
the true electrode potential V;
instead, we now have In the presence of finite solution resistance, this correction term must be determined in order to accurately determine the corrosion current. This can be done in a convenient manner using FT-EIS, where Nyquist spectra can be simultaneously recorded with LPR measurements. The high frequency intercept of the Nyquist plot on the Z¢ axis readily gives the value of Ru. This result can be combined with those of LPR measurements for accurate determination of Rp and icorr. © D. Roy
(2007)
Home || Research
|| Publications
|| Group
|


 .
.Currently this site is under construction